
UK average salary: full-time median pay hits £811.20 a week, a 2.7% rise after inflation
Provisional ONS figures put full-time median weekly earnings at £811.20 in April, up 5.8%, or 2.7% after inflation. For a pay review, the useful comparison is someone doing similar work near you.

The full-time employee in the middle of the UK pay scale earned £811.20 a week in April 2026, 5.8% more than a year earlier, or 2.7% once inflation is taken off. Strictly that’s the median, not the mean, but “UK average salary” is what the headlines will call it.
The figures are provisional results from the Annual Survey of Hours and Earnings (ASHE), which the Office for National Statistics (ONS) published on 22 October 2026. On ONS’s annual measure, full-time employees who had been in their job for at least a year had median earnings of £40,911, up 4.5%.
If you pay by the hour, the middle full-time rate was £20.81 before overtime, up from £19.68 a year earlier. Part-time pay grew more slowly: 2.9% before inflation, and a 0.1% fall after it.
It’s a fair yardstick for your hiring and pay decisions, as long as you compare like with like. The number worth comparing against is someone doing similar work, near you, on similar hours.
The UK average for your trade sits in ONS’s detailed tables
Most trade businesses are private sector, and there the full-time median was £794.40 a week, up 5.5%.
Where you work matters too. London had the biggest rise in full-time weekly pay, at 8.2%, against 5.8% across the UK. The smallest rises were in the East Midlands, at 4.0%, and the North West, at 4.1%.
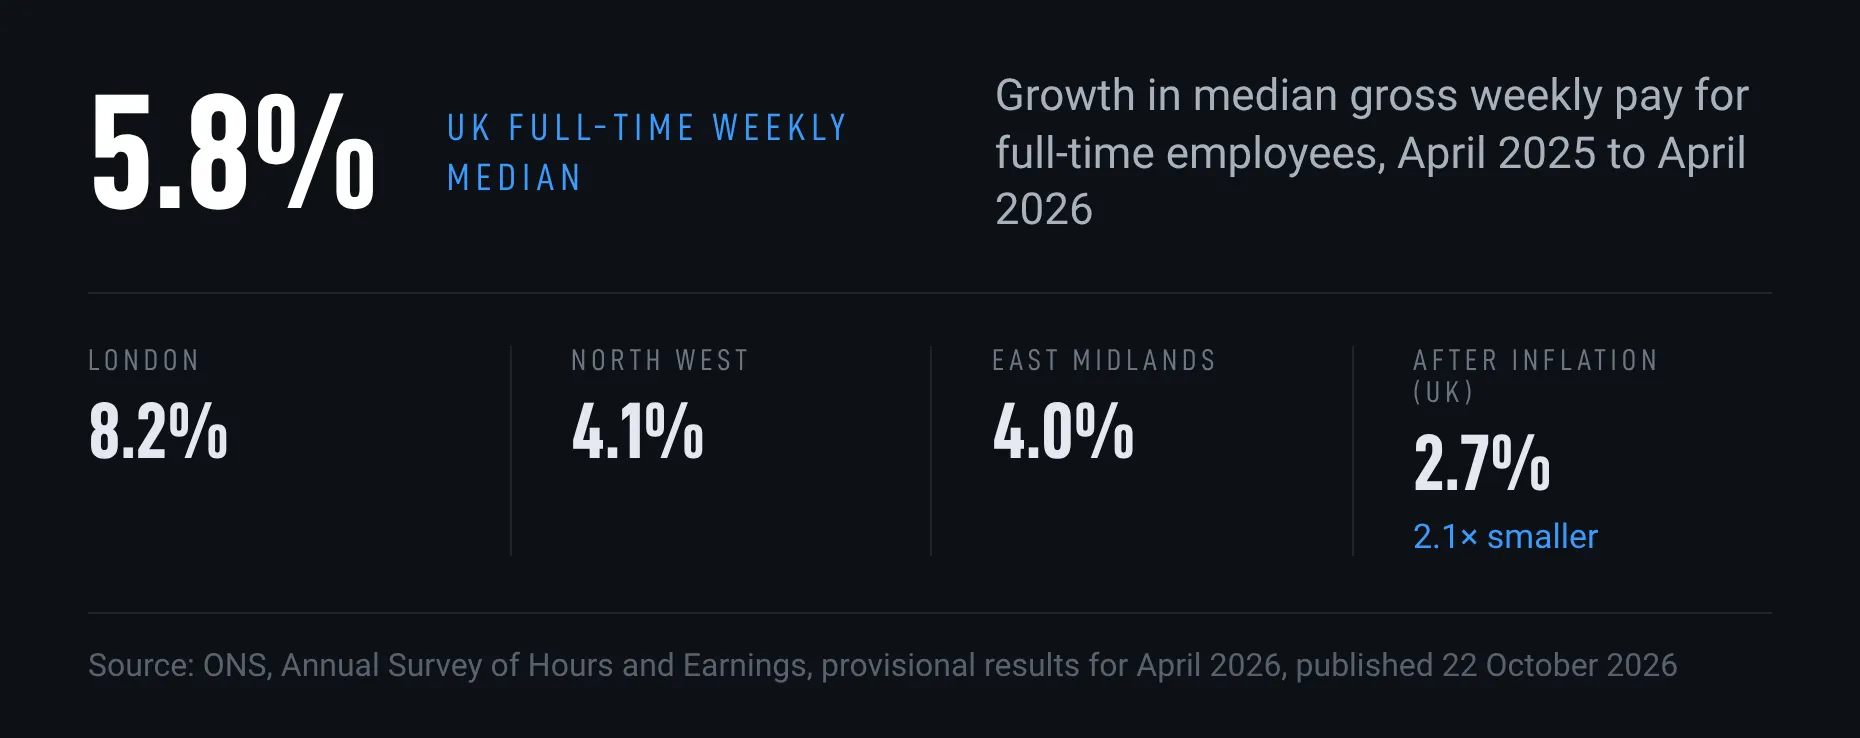
ONS says those growth figures reflect changes in the mix of jobs and workers as well as changes in pay. So the 5.8% is the middle of the scale moving, and it doesn’t mean every employee got that rise.
The figures for your trade in your region sit in ONS’s detailed tables. Table 3 breaks earnings down by region and occupational group, with full-time and part-time listed separately. Where a sample is too small, ONS leaves the figure out as unreliable.

Annual and weekly pay figures don’t convert into each other
ONS measures the annual figure differently. It includes pay affected by absence, such as parental leave, while the weekly and hourly figures cover adult-rate jobs where absence hasn’t touched the pay. ONS says the two aren’t directly comparable, so multiplying the weekly figure won’t land you on £40,911. Put annual salaries next to the annual median, and weekly or hourly rates next to those.
ASHE covers employees, found through PAYE records. If you also bring in subbies, subcontractor pay rates are a separate number.
Weighing an experienced hire against training your own? The weekly and hourly figures only cover adult rates. Is it worth taking on an apprentice runs that sum year by year, and the apprenticeship hiring payment for non-levy employers is worth checking before you decide.
These 2026 figures are provisional, and ONS publishes the final ones in October 2027. By then you’ll probably have done another pay review.

Trade resources for tradespeople, straight to your inbox.
Occasionally we will send you a newsletter. Free, unsubscribe in one click.
Keep reading

Scaffolding company fined £16,000 after a trainee's fall: neither scaffolder was clipped on
Michael Swales died after falling five metres from a scaffold he was helping to put up. HSE found no safe zones, and neither he nor his colleague was using a harness or lanyard. The guidance it points to covers exactly that stage of the job.

Plant training standards: tower crane and supervisor courses move back to phase 5
CITB has confirmed the plant training groups due for an update in early 2027. Tower cranes and lifting supervisor training have moved into this phase from the last one, alongside earthworks, cranes and demolition plant.

Right to work subcontractors: the self-employed you bring in can now count as your hire
The Home Office guide now covers individual subcontractors you bring in for a customer's job, and can make you liable for labour another business supplies. What protects you depends on who holds which contract.